4 Tidy Format
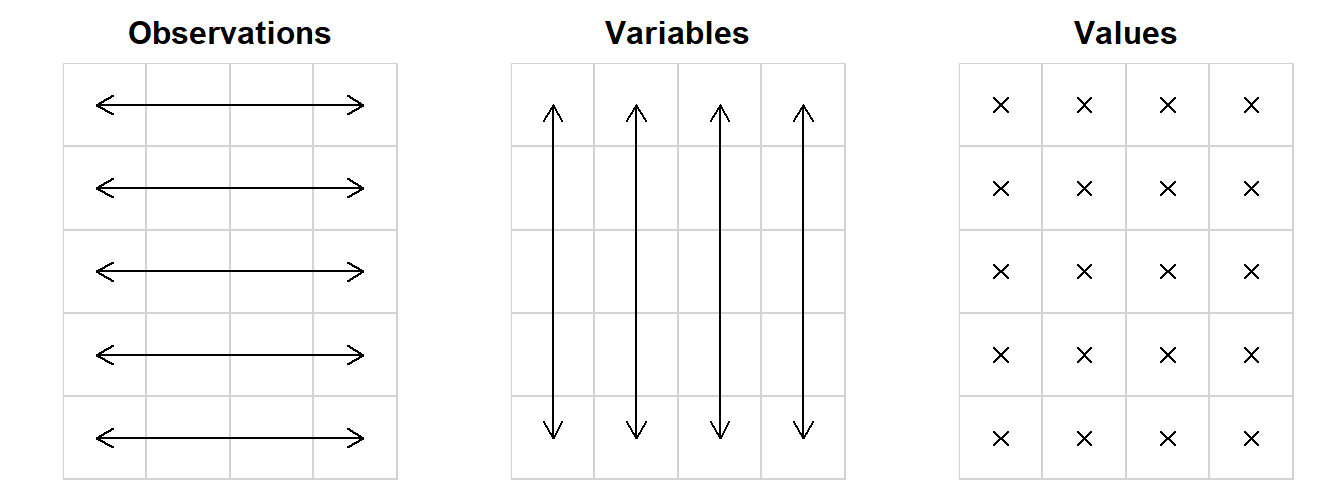
Collect data in a simple, consistent format called tidy data,[1] such that minimal effort is required to clean the data once you get to the analysis: Rows represent observations, columns represent the variables measured for those observations:
Good example
The iris data set (preinstalled with R) is in tidy format:
| Sepal.Length | Sepal.Width | Petal.Length | Petal.Width | Species |
|---|---|---|---|---|
| 5.1 | 3.5 | 1.4 | 0.2 | setosa |
| 4.9 | 3.0 | 1.4 | 0.2 | setosa |
| 4.7 | 3.2 | 1.3 | 0.2 | setosa |
| 4.6 | 3.1 | 1.5 | 0.2 | setosa |
| 5.0 | 3.6 | 1.4 | 0.2 | setosa |
| ... | ... | ... | ... | ... |
Here, the rows each represent one observation (a distinct flower), and the columns represent the variables measured/recorded (physical dimensions and species).
Bad example
A common deviation from tidy format is to represent groups as columns:
| women | men |
|---|---|
| 114 | 123 |
| 121 | 117 |
| 125 | 117 |
| 108 | 117 |
| 122 | 116 |
Do you have different groups? Time points? Replicates of the experiment? Then try to adhere to the same principle: Columns are variables. Simply add a variable that indicates which group/time point/replicate this observation belongs to:
| sex | SBP |
|---|---|
| female | 114 |
| female | 121 |
| female | 125 |
| female | 108 |
| female | 122 |
| male | 123 |
| male | 117 |
| male | 117 |
| male | 117 |
| male | 116 |
Converting to tidy format
If you have data split by group/time point/replicate here is how you can convert it to tidy format:
# The untidy data set
Untidy
women men
1 114 123
2 121 117
3 125 117
4 108 117
5 122 116# Convert by hand
Tidy <- data.frame(
sex = rep(c("female", "male"), each = nrow(Untidy)),
SBP = c(Untidy$women, Untidy$men)
)
# Convert using a package (install if missing)
library("reshape2")
melt(Untidy) variable value
1 women 114
2 women 121
3 women 125
4 women 108
5 women 122
6 men 123
7 men 117
8 men 117
9 men 117
10 men 116If you have a simple data set like the one shown here, converting with the package reshape2 is easiest. Converting by hand may be slightly more work, but I prefer it because you can easily see what’s going on, add more variables if needed, etc.