T-test
Means
Mathematical formula:
\[\begin{align} \tag{1}\label{ttest} t = \frac{\bar{y}_1 - \bar{y}_2}{\mathrm{SE}} \end{align}\]Code:
# Formula depends on type, see examples.
t.test(y ~ x, data)
# Formula depends on type, see examples.
from scipy.stats import ttest_ind
ttest_ind(a, b, equal_var = False)Note: a and b have to be the values in either groups, not the outcome and grouping variable.
Symbols
- \(t\): The \(t\)-value (test statistic from which a \(p\)-value is computed)
- \(\bar{y}_1\): Mean of group 1
- \(\bar{y}_2\): Mean of group 2
- \(\mathrm{SE}\): Standard error of the difference (calculation depends on the type of \(t\)-test)
Explanation
Also see the video on \(t\)-tests .
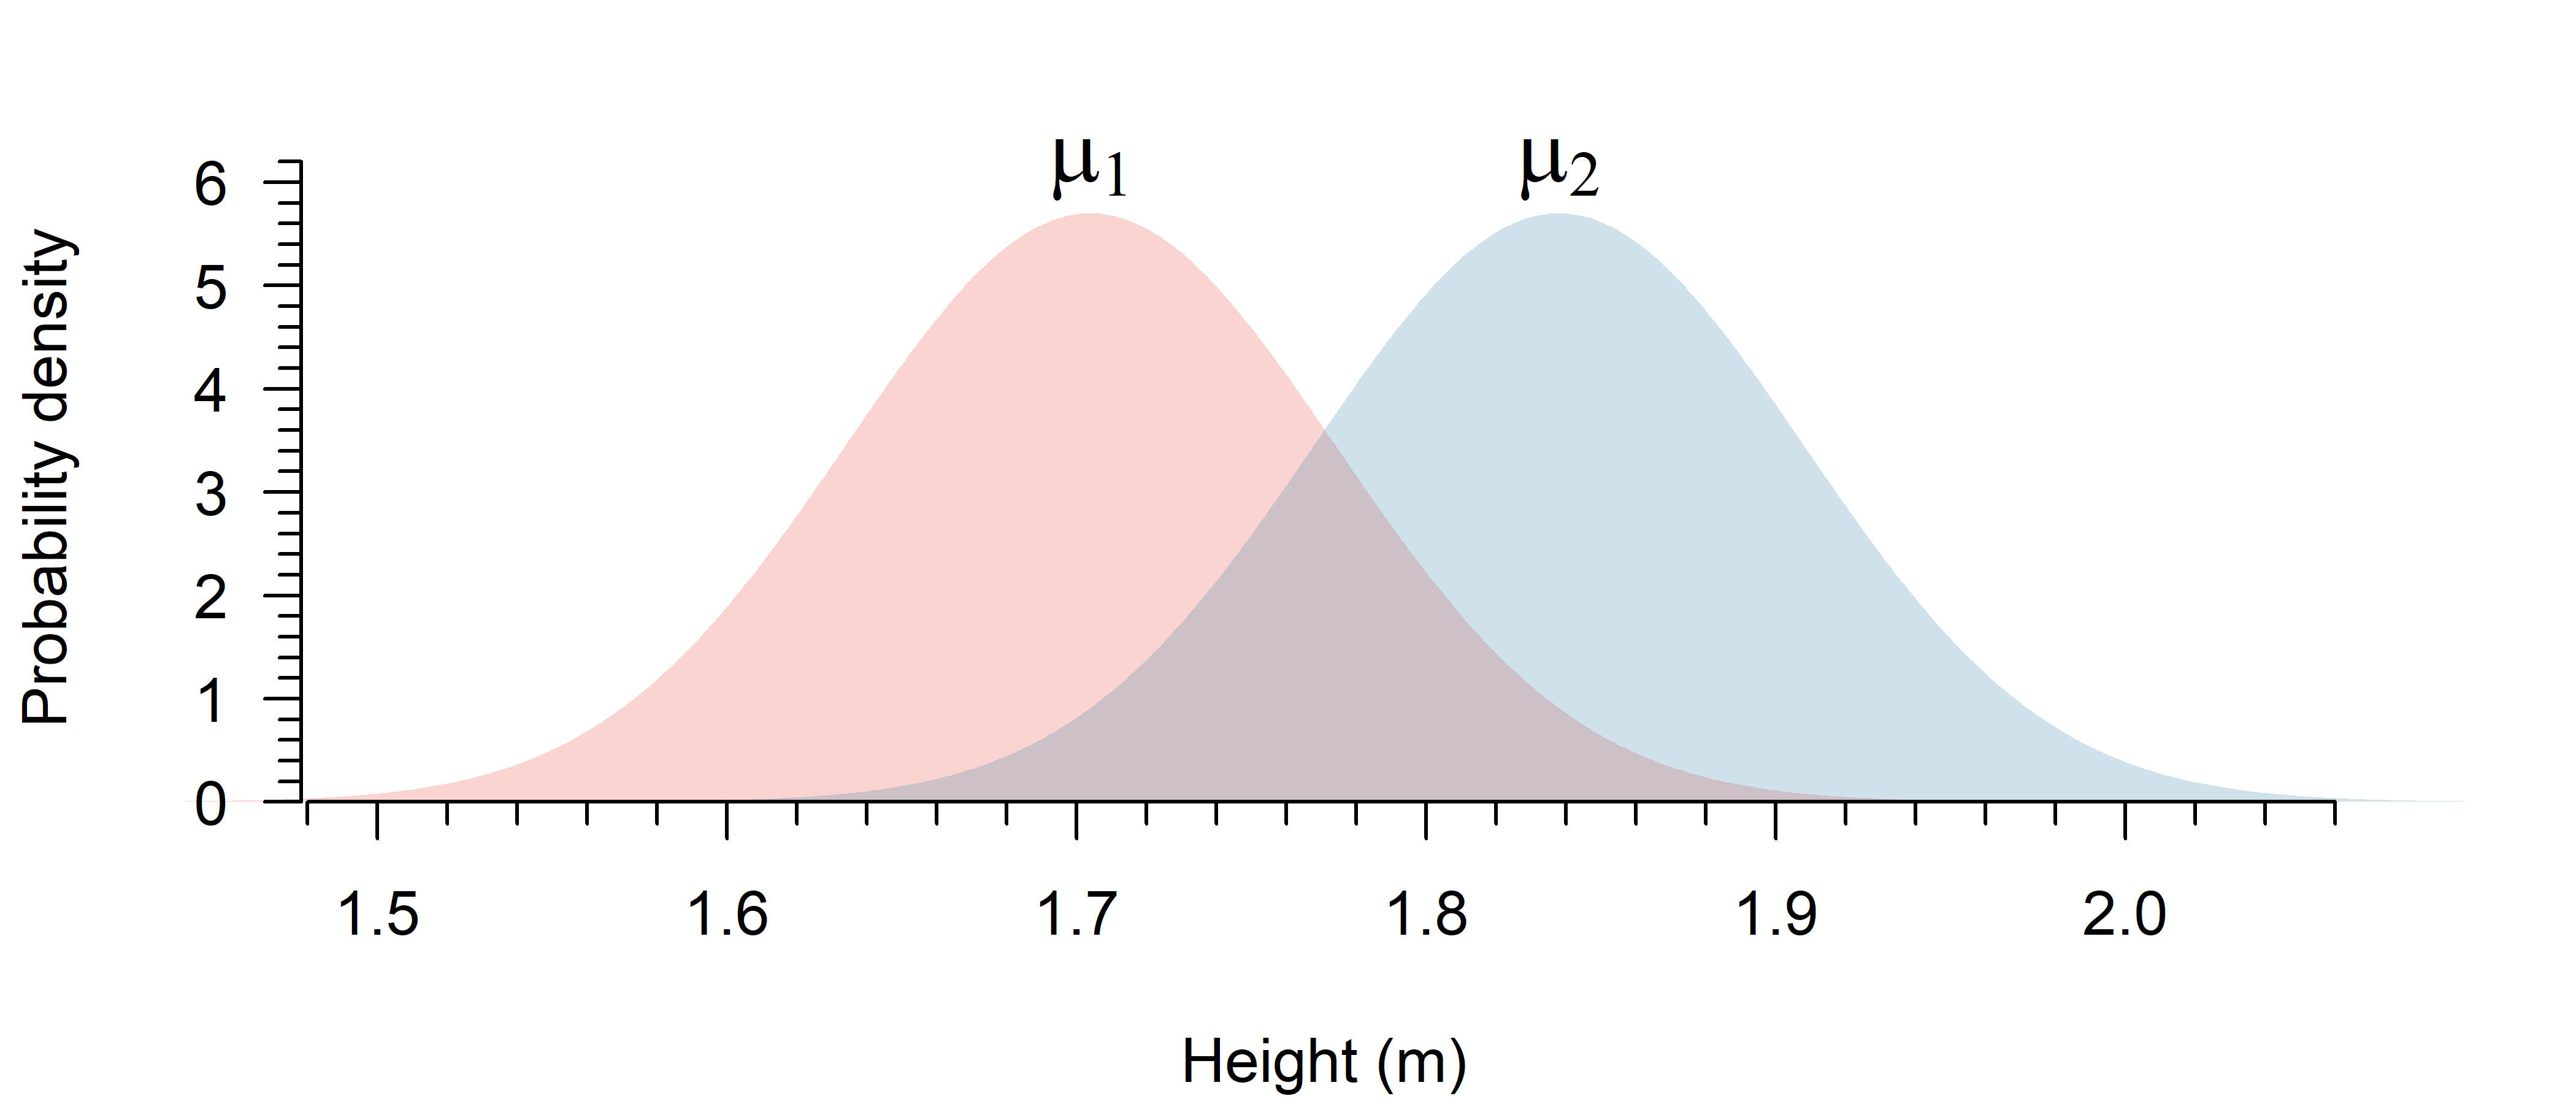
Suppose we draw 15 random males and females:
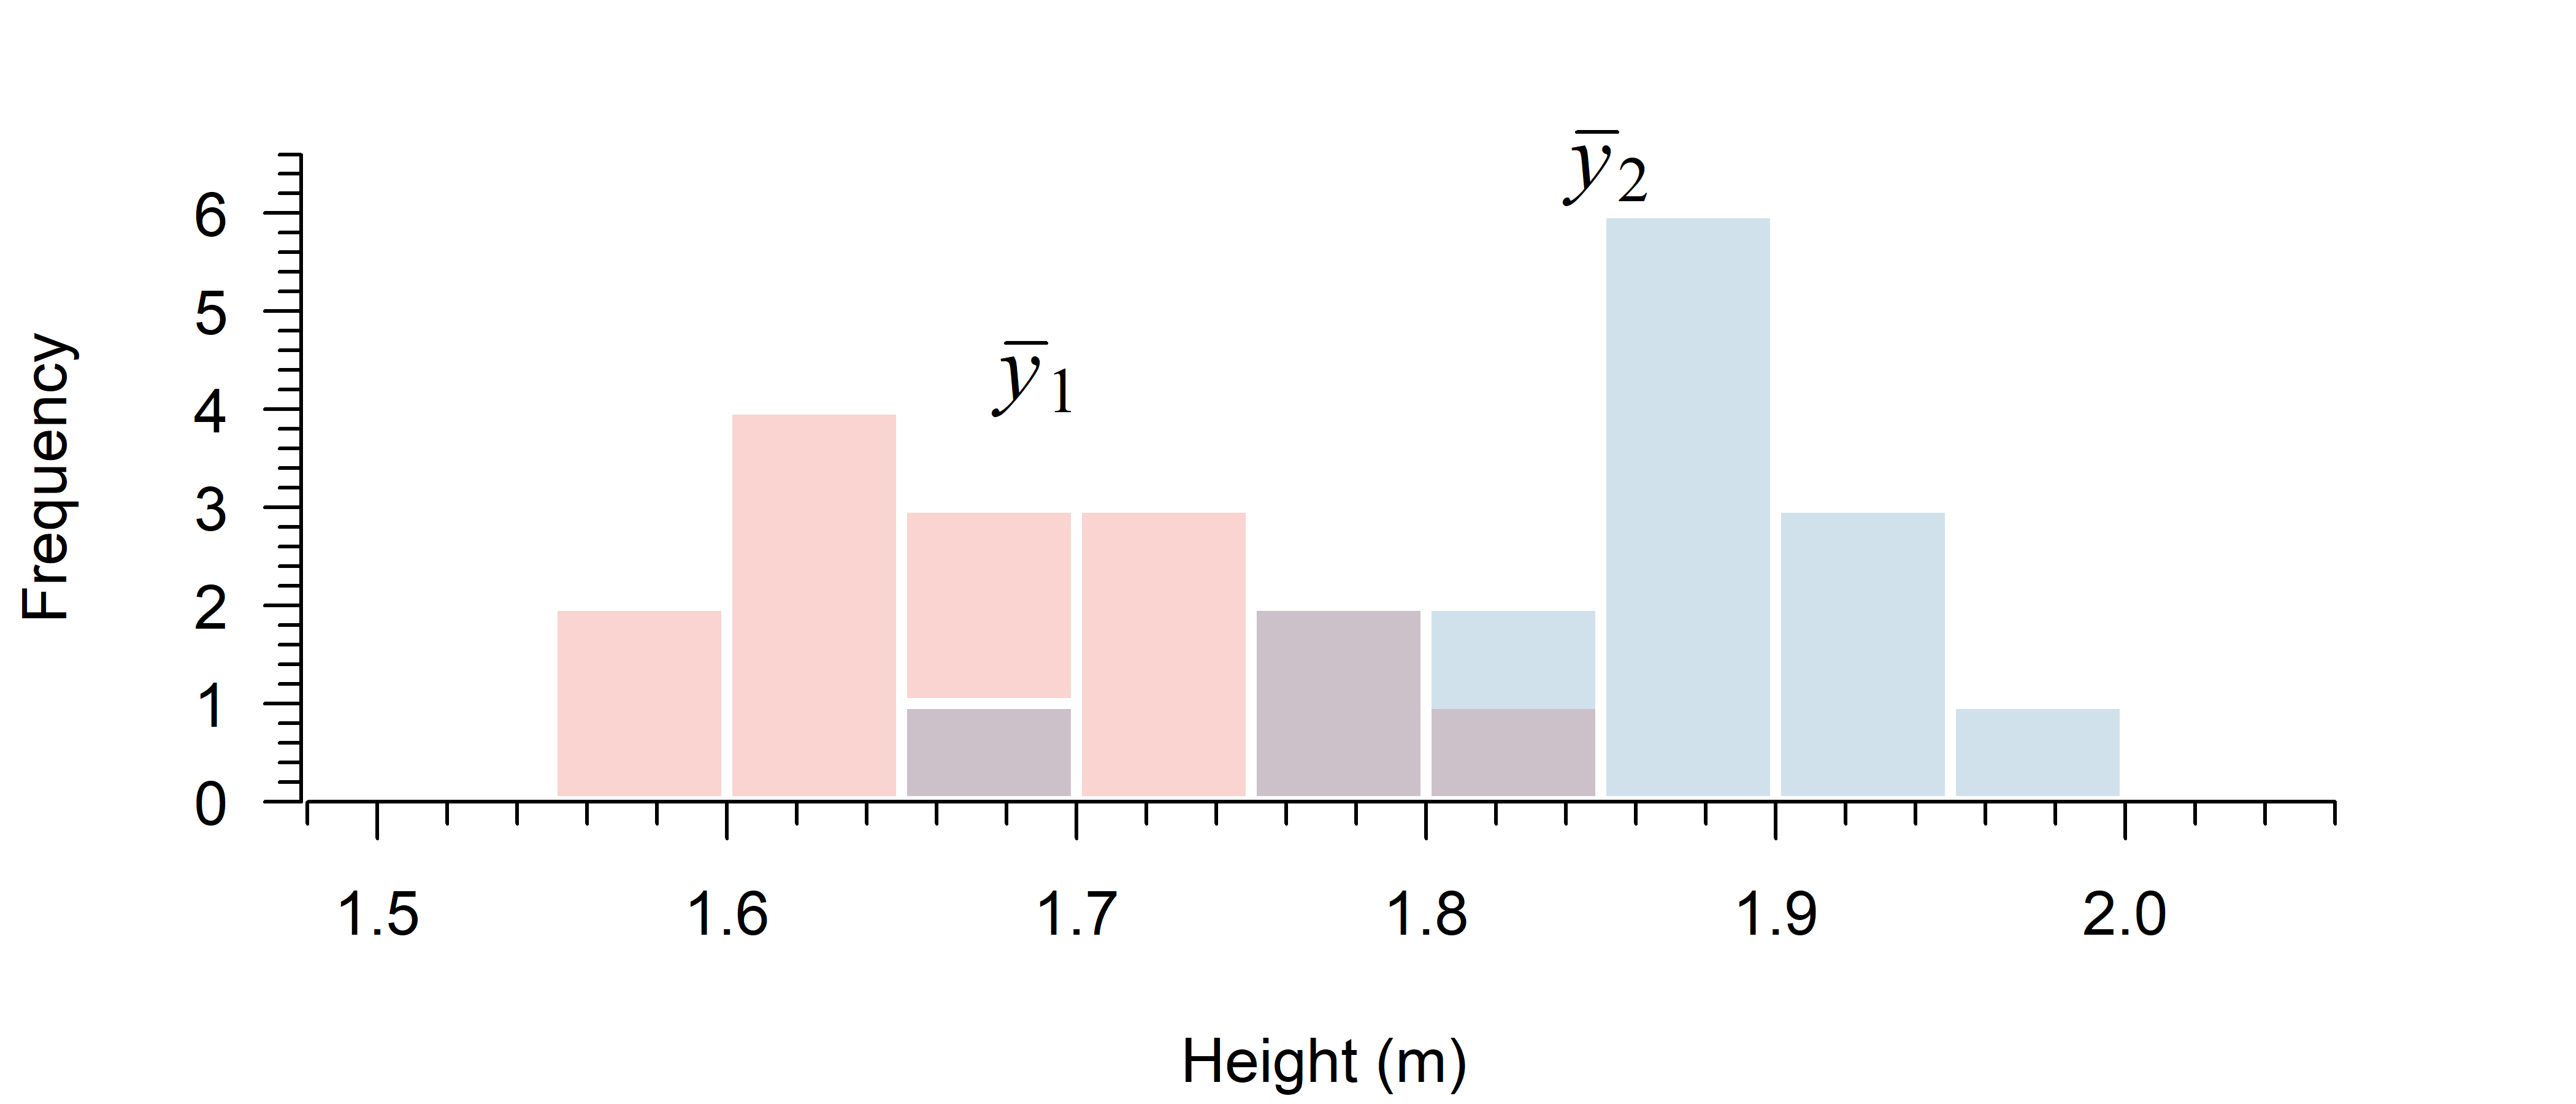
All we have is a sample. You can calculate the sample mean (\(\bar{y}\)) of a group, but that is only an estimate of the true group mean (\(\mu\)). Since we have estimates, there is uncertainty.
Our level of evidence \(t\) is then the difference in estimated group means, divided by the uncertainty of the estimated difference:
\[t = \frac{\text{difference in means}}{\text{uncertainty}}\]
How this uncertainty (called the standard error) is calculated, depends on the type of \(t\)-test used.
Once you have a \(t\)-value, you can use it to compute a \(p\)-value: